Tables vs. Lists in Excel- Understanding the Difference for Data Organization

Organizing data in Excel is key to efficient analysis and insightful results. But when it comes to choosing between tables and lists, many users get stumped. While both seem similar at first glance, they offer distinct advantages and limitations. Let’s delve into the world of tables and lists to help you choose the perfect tool for your data needs.
Lists:
- Structure: Simple rows and columns with basic formatting.
- Flexibility: Easy to add, remove, or edit data anywhere in the list.
- Limitations: Limited data analysis functions, difficult to filter or sort complex data sets, susceptible to formatting inconsistencies.
Tables:
- Structure: Organized data sets with predefined headers, borders, and automatic formatting.
- Data Analysis Powerhouse: Built-in formulas, slicers, and timelines for easy analysis and visualization.
- Filtering and Sorting: Powerful filtering and sorting options based on column headers.
- Consistency: Automatic formatting changes applied to the entire table, minimizing errors.
- Limitations: Slightly less flexible for rearranging data, may require additional steps for certain data manipulation.
When to Choose a List:
- Small, temporary data sets: For quick tasks or reference lists, lists offer fast and simple data entry.
- Unstructured data: If your data doesn’t require analysis or sorting, a list might be sufficient.
When to Choose a Table:
- Large or complex data sets: Tables handle intricate data with ease, enabling powerful analysis and visualization.
- Frequent filtering and sorting: If you need to filter or sort your data based on various criteria, a table is the way to go.
- Professional presentation: Tables offer a cleaner and more professional look for sharing your data.
Bonus Tip: You can easily convert a list to a table and vice versa in Excel! Right-click your data range and choose “Format as Table” or “Convert to Range” depending on your needs.
Download our infographic for quick reference!
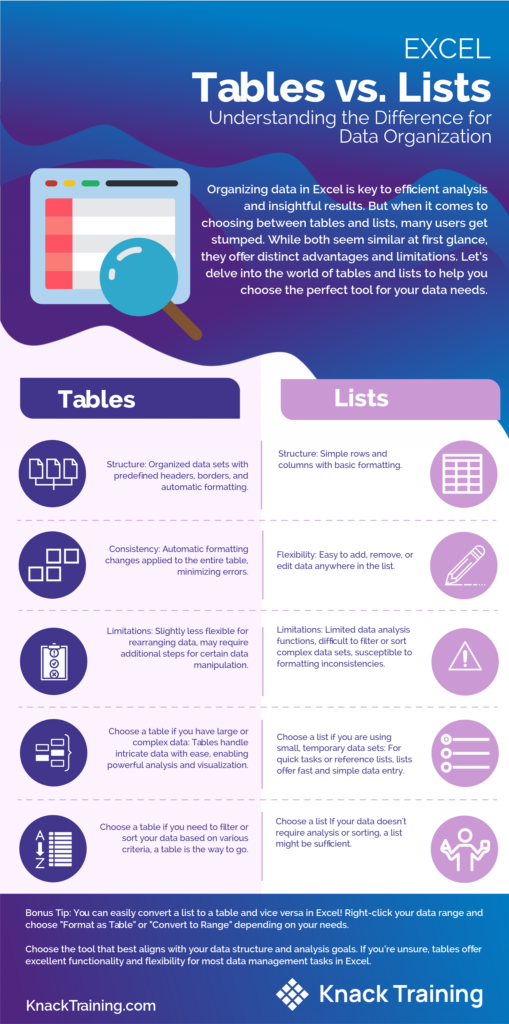
Choose the tool that best aligns with your data structure and analysis goals. If you’re unsure, tables offer excellent functionality and flexibility for most data management tasks in Excel.
So, go forth and conquer your data! Tables and lists are powerful tools at your disposal, and understanding their differences is key to unlocking their full potential.
Related everyday office posts


Building a Color-Coded Calendar Grid in Excel
People are always badmouthing Excel and working in various new and powerful data visualization tools. In this video, we duplicate...

Going Text to ROWS with Power Query
Text to Columns is a common tool in Excel (although the Text to Columns feature in Power Query, called Split...
Related recources

A Beginner’s Guide to Power Query
Power Query is Excel's new ETL tool - whether you’re talking about Excel or Power BI, when you extract, transform, and load the data into a report, you’re doing it with Power Query.